Health & Fitness
We're headed into the heart of Fall, What will it bring?
I also have a sneak peek at what Ol' Man Winter may bring us!


It's been a quiet month weather-wise so far with nothing too earth shattering on the horizon at the moment. But later this weekend we'll see a chance for some rain and then a very fall like cool down. Maybe a week after that we may possibly see some very unseasonably cold temps invading the south.
A cold front will be approaching the southeast later this week, and it will weaken as it approaches Georgia and stalls somewhere along the Gulf coast. The moisture will return as a southwest flow overrides the front and brings a chance for stratiform rain for much of the area. We're starting to see a pretty big ridge out west and blocking near Greenland and Canada, which leaves a large trough in the center of the country, as well as a little bit of an active suppressed flow. October is tough to forecast because it's a transition month. My meteorologist friend Robert Gamble at Wxsouth.com pointed this out in his latest post:
"It’s a tough nut to crack in October, with a pattern change and a lot of tropical moisture in the Pacific that is affecting or injecting so much heat in the flow, that could really amp up the flow in the Pacific, which makes forecasting beyond 7 days hard to get right. I do still strongly believe a cold front just beyond 10 days will probably be pushed by a 1030 or 1040 mb high and will be the first major cold front of the Fall…but timing it is nearly impossible yet."
If these split-flow situations develop like this during the winter months, it can lead to a really big mess in terms of ice and freezing rain, but well see how that works out when winter gets here. In the meantime, several model runs recently have been showing a western closed ridge, which means Pacific troughs break into two parts, leaving the southern part aiming for southern California and the southwest 4 corners area, and taking a path through the southern US during the week 2 time frame. Arctic air is building very rapidly over the pole this year, as well as into Siberia and Russia. Models are showing some of this cold air poised to push into the continental US in a week or two, so get ready for the tumble into winter!
As it is now, once the front passes our area during the Saturday/Sunday time frame, much cooler and dryer air will enter the picture, with highs on Sunday and Monday in the high 60's, and night time temperatures in the mid to upper 40's. Right now our normal highs and lows are 75/49 and by the end of the month, those drop to 66/44 degrees. It's looking like the last half of this month is going to be pretty cool for this time of year.
The winter weather possibilities are getting very interesting for Georgia this year. A weak El Nino and/or an active southern jet may bring several large winter storms to the northern part of Georgia this winter. Storms that are created with a split flow are almost always overrunning events, in which a southwest flow brings warm moist air over the colder air at the surface. Many times we have a wedge (one of those CAD (Cold Air Damming) events), and with the warm moisture falling through the cold air, we get ice and freezing rain. It's been a long time since we've really had any ice storms (the winter of 2009-10 and the big snow jam was the last one we had I believe, and it wasn't a "true" ice storm, just some ice on top of snow) so we're way past due in that department. Hopefully it will be cold enough for all snow, but only time will tell.
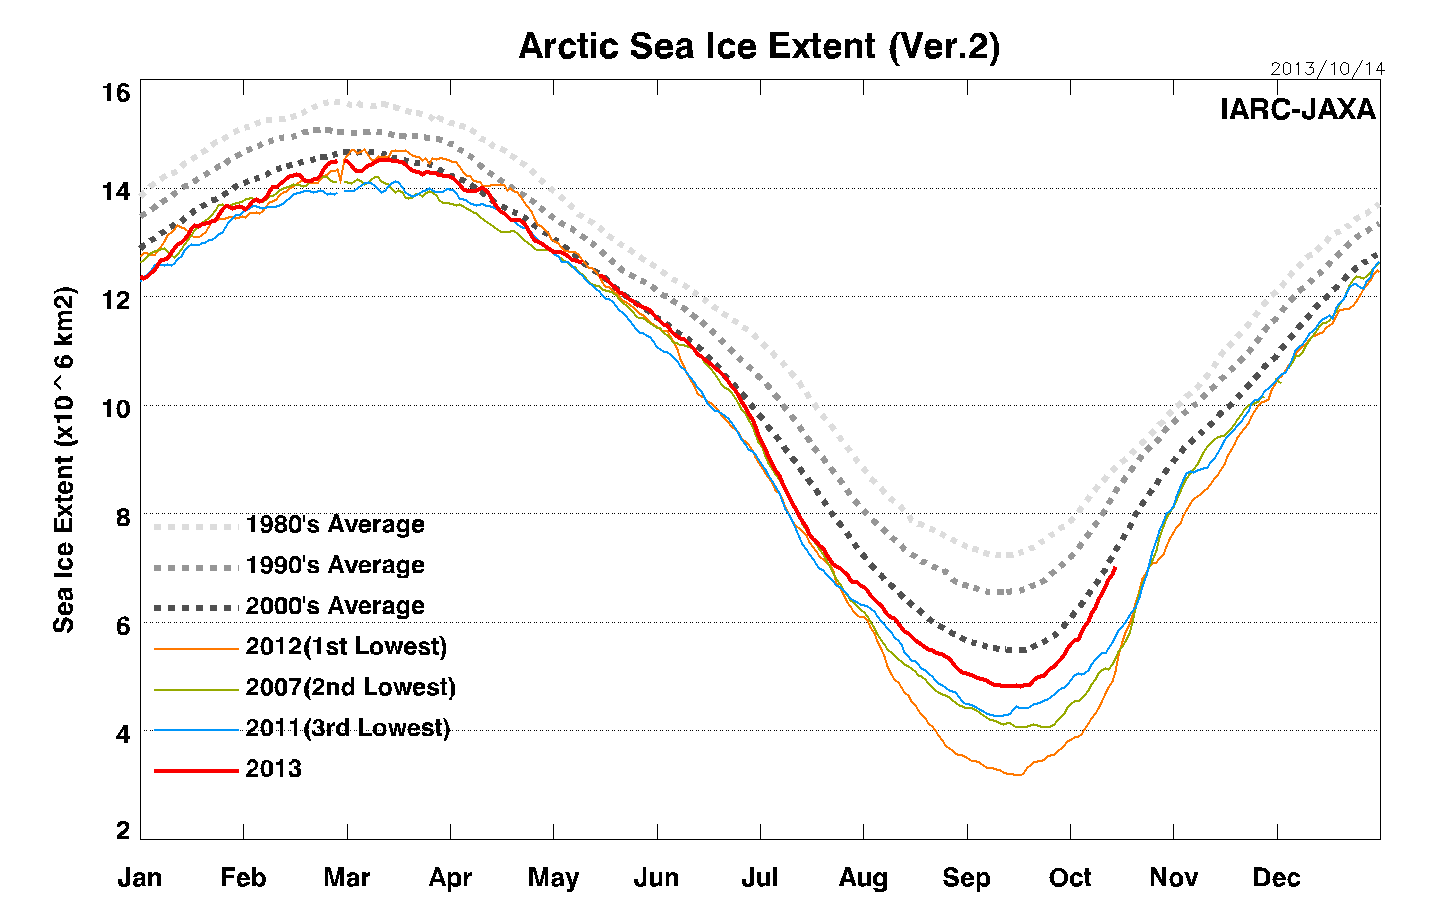
World-wide snow cover is on the rise and way ahead of the previous years. We're currently well ahead of last year and even October 2009 which had a massively negative AO. Sea ice is currently higher than any year since 2006 (see images above) and is about to go above the average level for all of the the 2000's years. Well be watching the teleconnections (some of the graphs on that page are not working due to the government shutdown) now that winter is approaching and will be looking for (and hoping for) -AO and -NAO blocking to take shape. We're already seeing some of that here in October and hopefully that will continue and help carry us through winter.
Another one of my weather friends we'll call Larry, has some interesting statistics regarding weak Nino's. Here are the results from his research:
"11 Coldest (back to 1879-80) KATL Winters’ ENSO/PDO/NAO/AO
Find out what's happening in Daculawith free, real-time updates from Patch.
Winter……DJF Temp Anom…ENSO……..PDO………NAO….…AO
1) 1976-1977……….…..-7.6…………WEN…....+1.5………..-1.7………..-1.8
Find out what's happening in Daculawith free, real-time updates from Patch.
2) 1977-1978…………...-6.2…………WEN…….+0.7……….-1.1………..-0.5
3) 1904-1905……………-5.8………...WEN…….+1.3……….+0.8……….+0.8
4) 1962-1963……………-5.8…………WLN……..+0.0……….-1.6………..-0.7
5) 1935-1936……………-5.7………….NP………+1.5………-2.0………..-2.4
6) 1963-1964……………-5.7…………WEN…….+0.4………-1.6………..-0.7
7) 1939-1940………..….-5.5…………WEN……..+1.7……...-1.9………..-1.9
8) 1901-1902…………...-5.4………….NN………+1.5………-0.7………..-0.5
9) 2009-2010………..….-4.4…………SEN……..+0.1……..-2.9…………-2.6
10) 1885-1886………….-4.3…………WEN……..+0.8……..-0.6…………N/A
11) 1969-1970……..…..-4.1………….WEN……..+1.2…….-1.1…………-1.8
Findings:
A very impressive 7 of the 11 coldest (of the 133 winters) and 3 of the 4 coldest were weak Nino’s. Keep in mind, only about 1 in 8 winters is a weak Nino. So, only about 1-2 of the 11 coldest would be the “expected value” (vs. 7) if there were no bias of weak Nino’s toward either warm or cold.
- The PDO was positive for all 11 (1962-1963 was barely above zero).
- The NAO was -0.6 or more negative for all but one, 1904-1905.
- The AO was -0.5 or more negative for all but one, 1904-1905. (I couldn't find the AO for 1885-1886.)
Based on the above stats, I’m fully aware that one can make the argument that it was the +PDO/-NAO/-AO combo that was a big reason for the cold for all but 1904-1905. However, one could make the argument that the weak Nino phase, itself, also had a major influence. I’ll now explain:
I looked at all winters back to 1879-80 and found 26 that had the +PDO/-NAO/-AO combo, including the 9 noted above from the 11 coldest.
- A total of 6 of those 26 were weak Nino’s.
- An impressive 5 of those 6 weak Nino’s (83%) were within the 11 coldest.
- On the other hand, 20 of those 26 +PDO/-NAO/-AO winters were NOT weak Nino’s.
- Only 4 of those 20 that were +PDO/-NAO/-AO and that weren’t weak Nino’s (20%) were within the 11 coldest.
- Furthermore, 10 of the 26 were moderate to strong Nino’s. Of those 10 moderate to strong Nino’s with +PDO/-NAO/-AO, only one of the 10 (10%) (2009-10) was within the 11 coldest.
So, to summarize regarding +PDO/-NAO/-AO winters since 1879-80:
- A whopping 83% of the weak Nino’s were in the 11 coldest
- Only 10% of the moderate to strong Nino’s were in the 11 coldest
- Only 20% of all winters that weren't weak Nino’s were in the 11 coldest
- 40% of weak Nino’s and 47% of moderate to strong Nino’s since 1899-1900 were +PDO/-NAO/-AO….ie., fairly similar percentages. Yet, weak Nino’s were much colder on average than moderate to strong Nino’s as a whole.
(MEN’s/SEN’s that didn’t have +PDO, -NAO, and –AO:
1902-1903, 1905-1906, 1965-1966, 1972-1973, 1982-1983, 1987-1988, 1991-1992, 1994-1995, and 2006-2007)
- Conclusion:
The weak Nino phase, itself, has a strong cold tendency for Atlanta independent of the cold tendency resulting from +PDO/-NAO/-AO. "
********* EDIT:Here's some additional data from Larry
"Folks,
Prior to 2011-12/2012-13, Atlanta hadn't had back to back seasons of a trace or less of S/IP since 1973-4/1974-5. Here are all of the back to back trace seasons as well as the subsequent seasons since records started in 1879:
A. 1915-16/1916-17: 1917-18, a neutral negative ENSO winter, had a whopping 8.0" of S/IP, which is the 8th snowiest/sleetiest on record since 1879-80! This included a 4.9" major snow/sleet (much of it sleet) 12/11-13. There also was a major ZR 1/21! This was the 12th coldest DJF on record. This was easily a top 10 winter for Atlanta weenies!
B. 1943-44/1944-45: 1945-46, a weak La Nina, had 0.6" of S/IP as well as a major ZR 12/24-25 for Santa! DJF averaged near normal temperaturewise.
C. 1948-49/1949-50: 1950-51, a weak La Nina, had only a T of S/IP. This was the only instance on record with three seasons in a row with only a T. DJF averaged near normal temperaturewise.
D. The subsequent season, 1951-52, a weak El Nino, had a major S/IP of 3.9" on 2/26. DJF averaged above normal temperaturewise.
E. 1955-56/1956-7: 1957-58, a strong El Nino, had a significant S/IP of 2.7" on 2/15. DJF averaged below normal temperaturewise.
F. 1973-74/1974-75: 1975-76, a strong La Nina, had 0.6" of S/IP. DJF averaged near normal temperaturewise.
Summary: For the six KATL following back to back T of S/IP seasons, there were an impressive 4 major winter storms vs. an expected value of about 3 in 6 seasons. Getting 2 major ZR's in 6 seasons beat the average somewhat. Getting an average of 2.6" S/IP for these six seasons beat the longterm average of ~2.0". Winterstormwise, I'd say that 4 of the 6 (2 of 3) would have been considered really good seasons. Meat Loaf surely would have been content. Perhaps this is somewhat encouraging for 2013-14!"
Note that the winter of 2009-2010 is one of those years. Fingers crossed... 'cause that's what the weathermen do! :-)
Like what you read here and want to be notified of new posts and updates? You can subscribe to this weather blog by clicking here and then clicking on "Get email updates"Please remember, whenever you need weather information, please visit us at the new and improved DaculaWeather.com. You can also get the latest weather information by following us on Twitter, Facebook, and here on the Patch! DaculaWeather.com... Your Window to the Weather